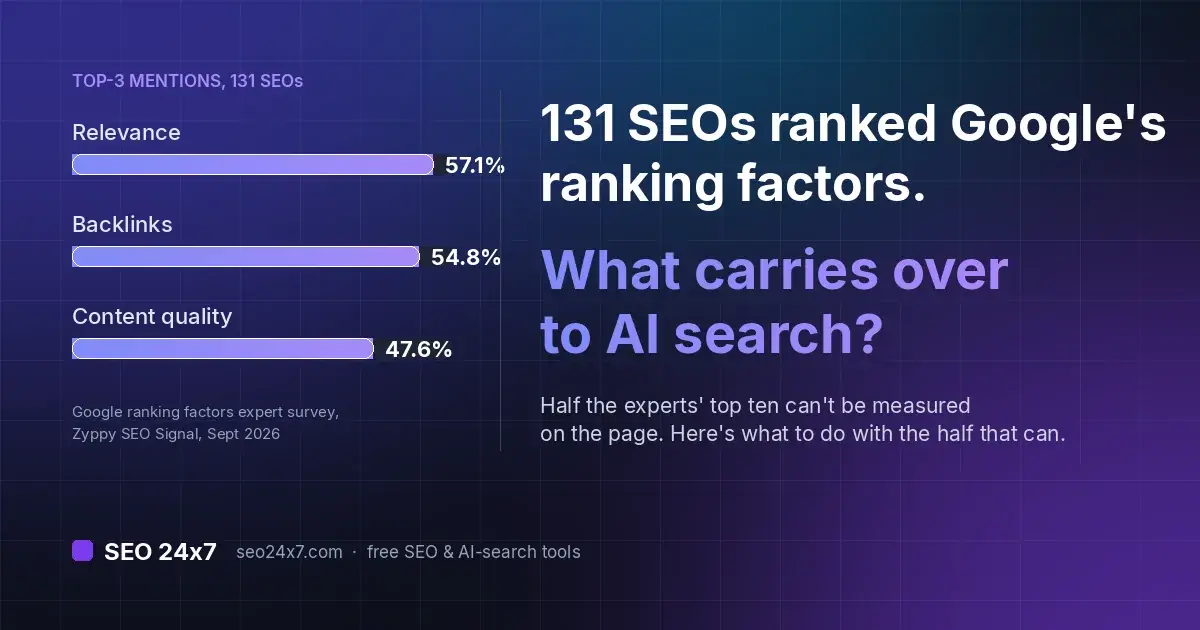
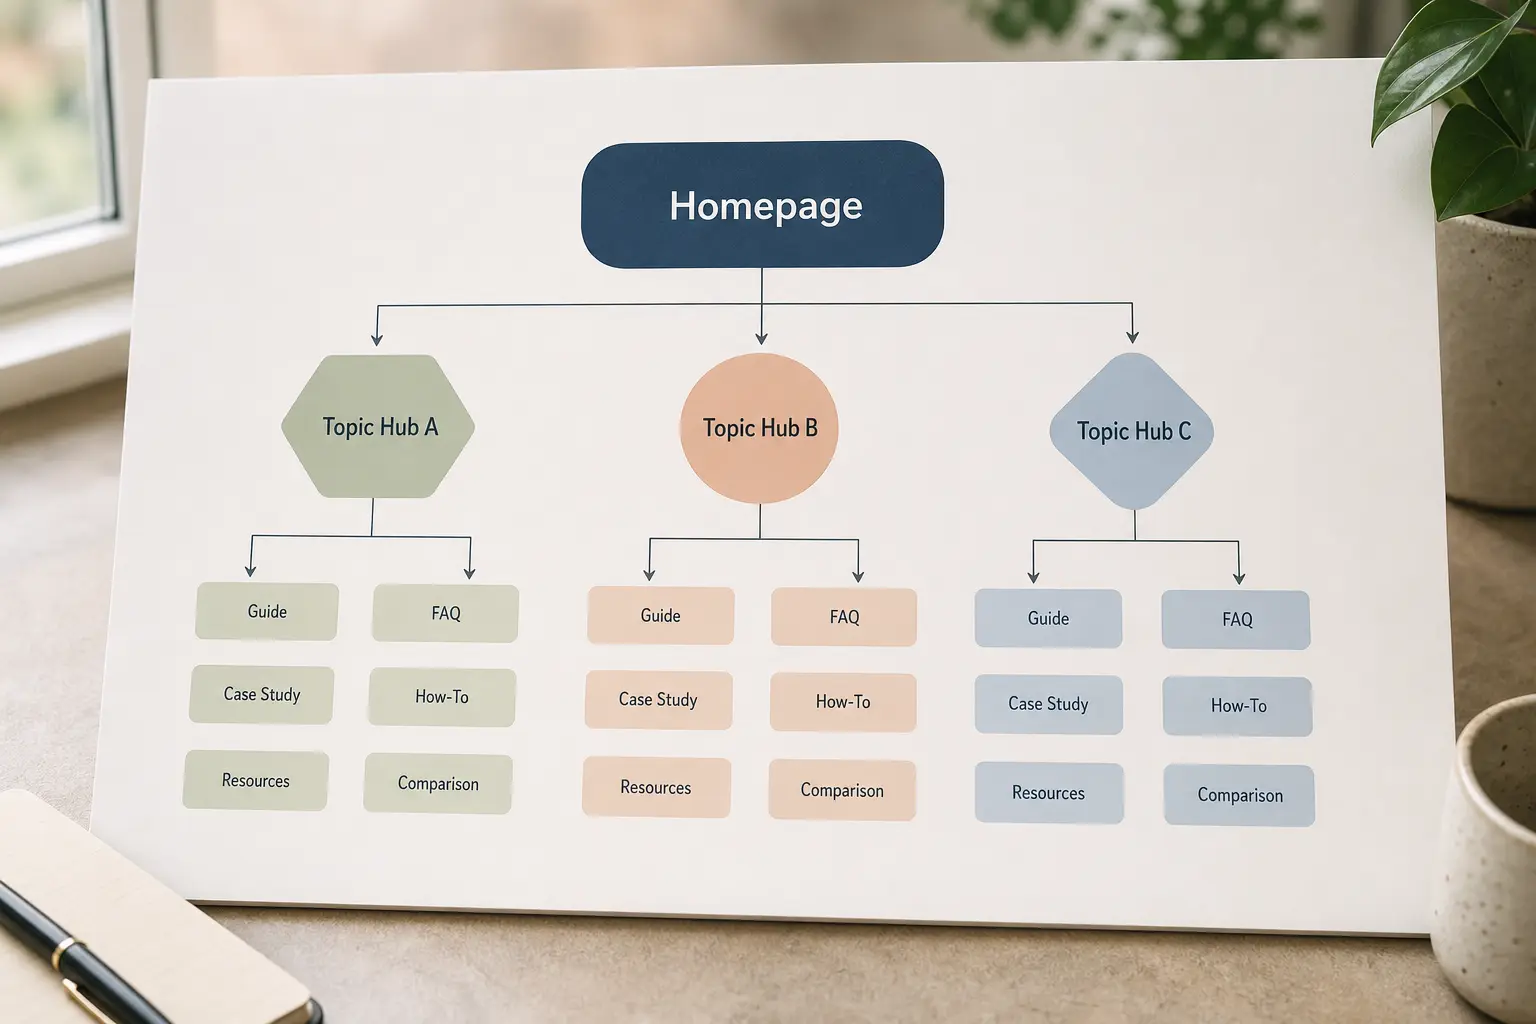
Before reporting an SEO result, record the pre-change baseline, the deployment date, a comparable post-change period and the other plausible causes you investigated. Without those records, the data may show an association, but it cannot support a strong attribution claim. Choose metrics that correspond directly to the pages, queries or outcomes affected by the change.
What makes an SEO result defensible
- Set the baseline before you touch anything: 8-12 weeks of stable data, or a full seasonal cycle if the site has one.
- Compare like periods. Year-on-year for seasonal sites, previous-period for stable ones, and never a hand-picked window.
- Annotate every change with a date, and only change one meaningful thing at a time when you intend to prove causation.
- Segment-level metrics (clicks to the pages you touched, impressions for the queries you targeted) survive scrutiny; sitewide traffic and average position rarely do.
- Publish the confidence limits alongside the result. "Probably caused this, here's what else moved" reads as more credible than a bare percentage.
What counts as a baseline, and how long does it need to be?
A baseline is the metric's normal range before your change, measured over a window long enough that ordinary noise averages out. Use enough pre-change data to capture the page set's normal weekly variation. Eight to twelve weeks can be a useful operating window for a reasonably active, non-seasonal site, but it is a heuristic rather than a statistical minimum; low-volume or seasonal sites may need a much longer comparison period. If the site has real seasonality (tax, school terms, Christmas retail, weather-driven trades), the baseline needs to cover a comparable seasonal position, which usually means comparing to the same window last year rather than the last quarter.
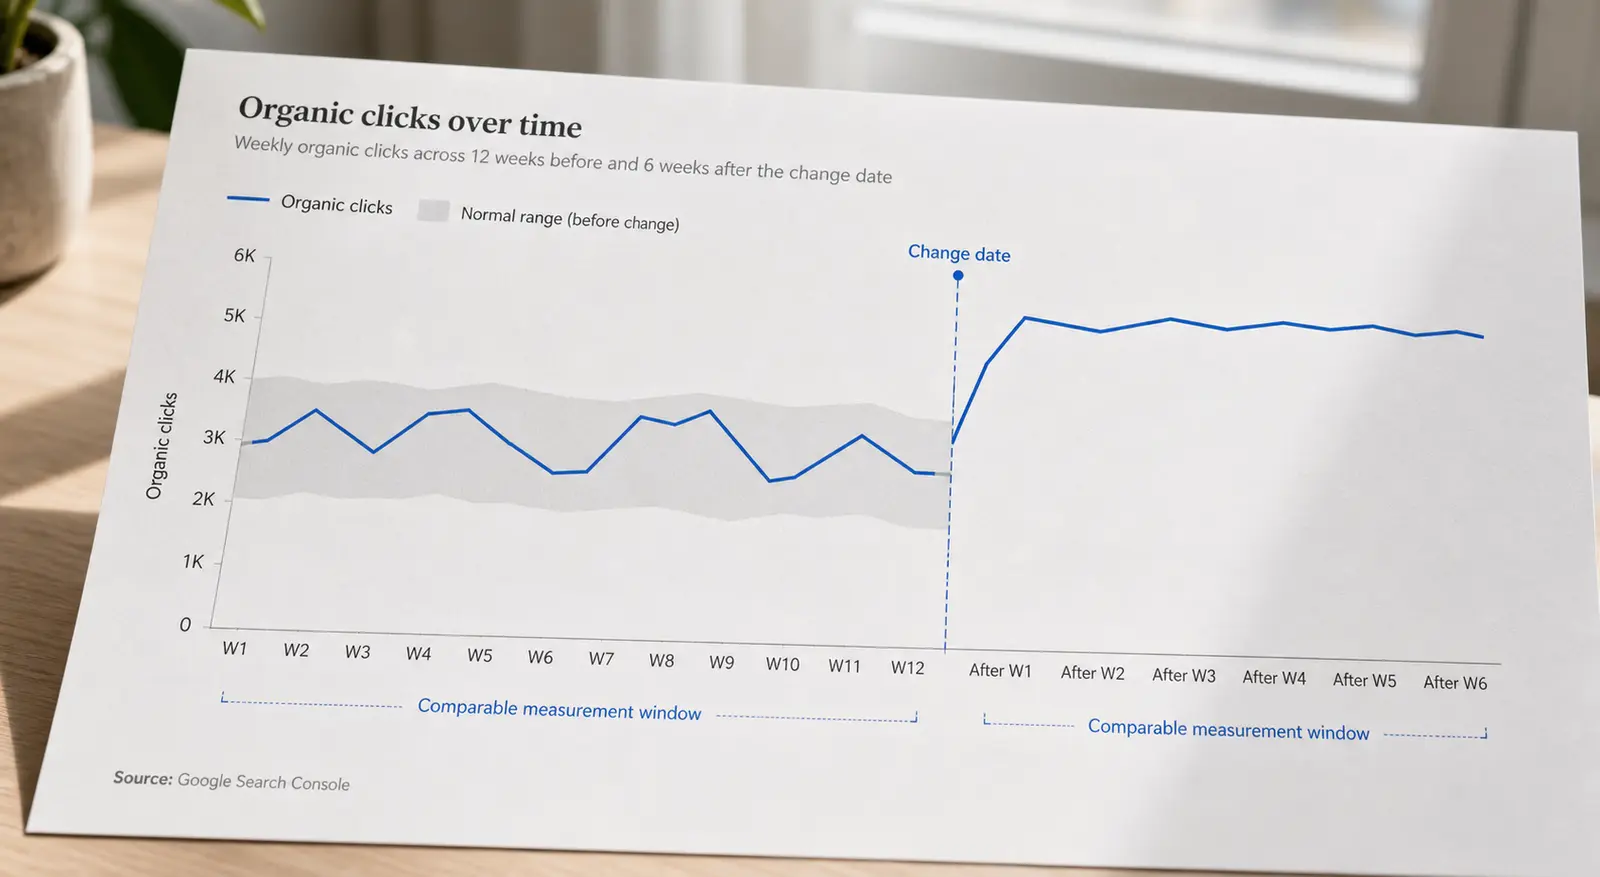
Record the range, not just the mean. If organic clicks to a page cluster ran between 340 and 520 a week across your baseline, then a post-change week of 560 is barely outside the noise band, and one week of 560 is not a result. Two months averaging 700 with the floor lifted to 600 is.
The test that separates a baseline from a number you wrote down: could someone else reconstruct it from the same data source without asking you what you meant? Name the property, the date range, the filter (page path, query, country, device), and the source. "Clicks, GSC, page filter contains /guides/, Australia, all devices, 1 Feb to 26 Apr" is a baseline. "Traffic was flat before" is not.
How do you separate correlation from cause?
You isolate the change, then you look for everything else that could explain the movement. In practice that means three habits.
Change one thing at a time when the claim matters. If you rewrite titles, add internal links, and fix render-blocking JavaScript in the same week, you have shipped a bundle and can only honestly claim the bundle worked. That is a legitimate result, but write it as one: "a bundle of three changes, shipped together on 14 March." Do not attribute the whole lift to whichever change is most interesting.
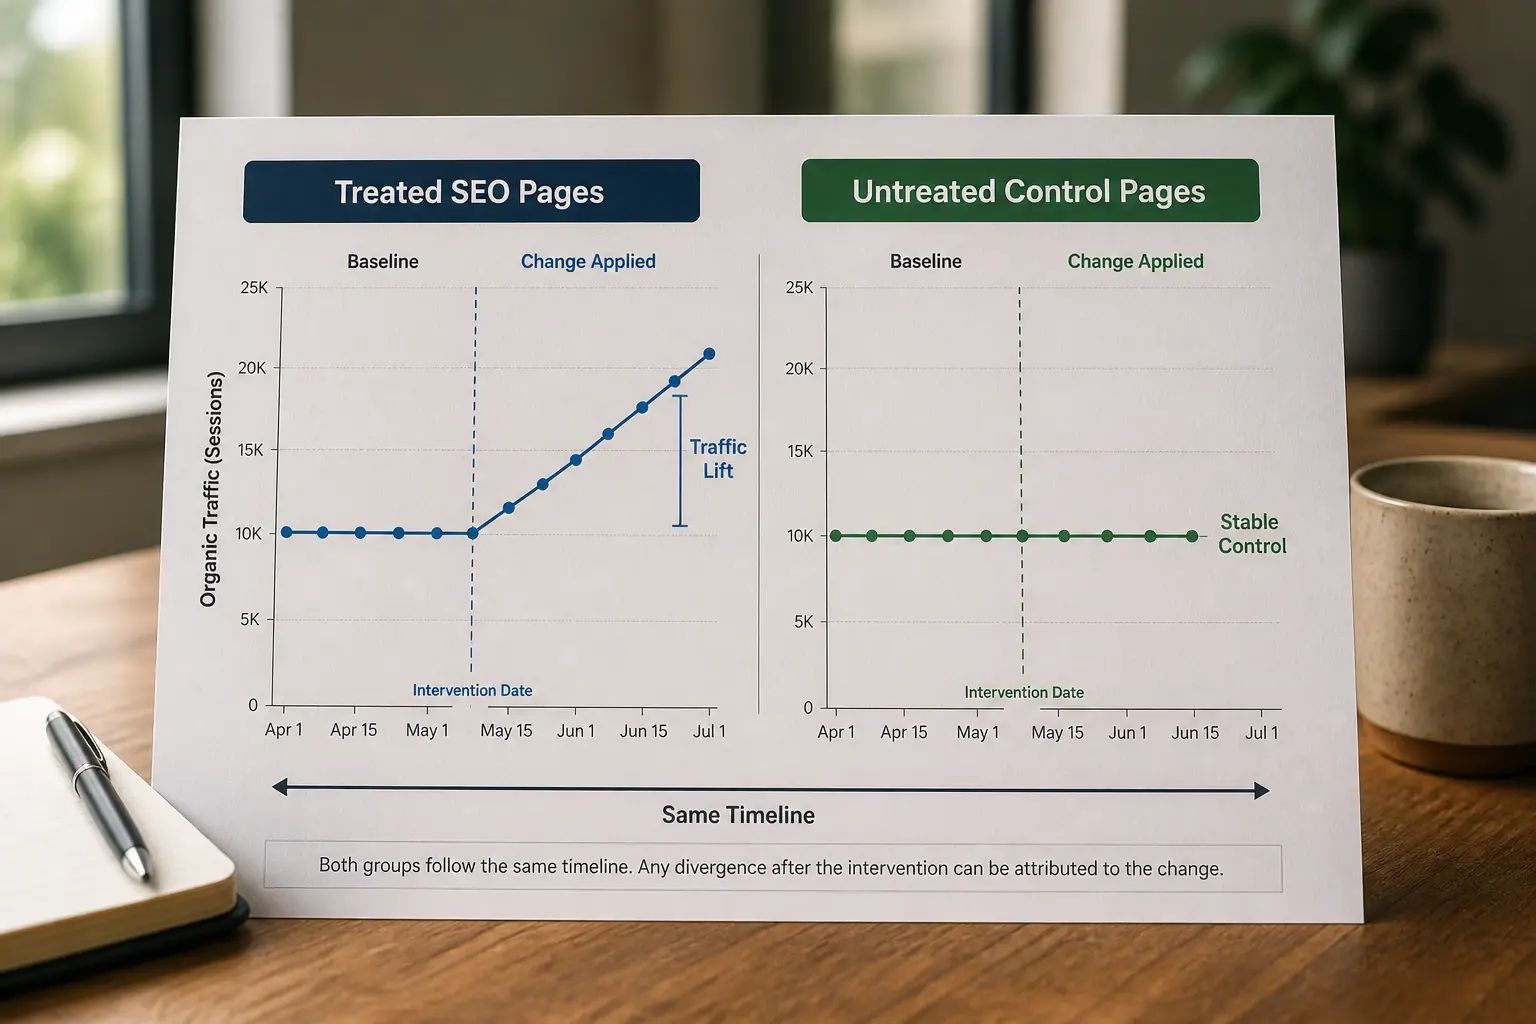
Use a control group inside the same site. A same-site control group gives you a stronger basis for distinguishing the effect of your change from movement affecting comparable pages. Split comparable pages into a treated set and an untreated set, matched on template, baseline traffic and intent, and apply the change to only one set. If treated pages rise 30% and control pages rise 28%, you found a seasonal tide, not a win. If treated rise 30% and control stay flat, you have something. The number of pages needed depends on baseline variance and the size of the effect you need to detect. Small groups can still reveal a large, consistent movement, but they cannot support the same confidence as a properly powered test; document the group size and treat the result as directional when no power calculation was performed.
Check the alternatives before you publish. Run the list every time:
- Google core or spam update: Compare your change date against known update dates
- Seasonality: Same window last year, same page set
- A competitor exiting or entering the SERP: SERP snapshot before and after for your top queries
- A SERP feature appearing or disappearing: Impressions flat but clicks moved sharply is the tell
- Another team's release: Ask about deploys, redirects, nav changes, CMS migrations in the window
- Tracking or reporting change: Property change, filter change, sampling, a new GSC property
- Regression to the mean: Was your baseline window an unusually bad patch?
Document the alternative explanations you checked and the evidence against each one. This lets a reader judge how much of the change can reasonably be attributed to the work.
Which metrics survive scrutiny, and which do not?
Prefer metrics that closely match the scope of the change. Broad aggregates and averages are harder to interpret because unrelated pages, queries and releases can move them during the same period.

Clicks to the specific pages changed
- Holds up when: Filtered to the treated URL set, compared to a control set
- Fails when: Reported sitewide
Impressions for targeted queries
- Holds up when: Query set defined before the change
- Fails when: Query set chosen after seeing what rose
Rankings for a named, fixed keyword set
- Holds up when: Set locked in writing at baseline, same tracker, same location and device
- Fails when: Keywords added or dropped mid-measurement
Conversions or assisted revenue
- Holds up when: Attribution model stated, channel isolated
- Fails when: Model unstated, last-click assumed silently
Indexed page count
- Holds up when: Paired with a reason to want more or fewer indexed pages
- Fails when: Presented alone as a good thing
Average position
- Holds up when: Almost never
- Fails when: Nearly always: it shifts when long-tail impressions enter or leave, with no ranking change at all
Domain-authority-style third-party scores
- Holds up when: As a rough directional check only
- Fails when: Presented as the outcome
"Keywords in top 10"
- Holds up when: Set and tracker are fixed and disclosed
- Fails when: Tracker's keyword universe expanded during the period
Average position deserves the specific warning. It is an average across every impression, so a page suddenly appearing at position 40 for a hundred new long-tail queries drags the average down while your actual rankings improved. Movement in average position, on its own, tells you almost nothing about whether you won.
Vanity metrics are not always useless, but they need a job. Impressions matter when you are testing whether new content gets crawled and served at all. They stop meaning anything once you are claiming a commercial result, because impressions can double while clicks fall.
How do you annotate changes so the timeline holds up later?
Keep a change log with a timestamp, and keep it outside your own memory. Every entry needs the date the change went live (not the date it was approved), the URLs affected, what changed in one sentence, and who shipped it. Use whichever dated record your team can reliably preserve and audit, such as an analytics annotation where the feature is available, a shared spreadsheet or a version-controlled change log. What matters is that the log was written when the change shipped, not reconstructed three months later when you decided to write it up.
Two details make a log actually useful. First, log the go-live date, since the deploy is what search engines see, and a change approved on the 3rd but deployed on the 17th will wreck your before-and-after if you use the wrong one. Second, log the things you did not do: the competitor who dropped out, the unrelated PR mention, the site outage. Those become the alternatives you rule out later, and you will not remember them.
Also record when you would expect the effect. Re-crawl and re-evaluation are not instant, and the lag differs by site and by change type. A title tag on a frequently-crawled page can move within days; a large internal linking change across a slow-crawled site may take considerably longer. Write down your expected lag before you measure, so you are not tempted to move the goalposts to wherever the data looks best.
How do you present a result honestly, with confidence limits?
State the number, the window, the comparison, the method, and the limits, in that order, and keep the limits in the same paragraph as the claim rather than a footnote. A result presented with its own caveats is more persuasive, not less, because the reader can see you looked for the ways it might be wrong.
A structure that holds up:
- The claim, with the metric, the exact figure, and the treated page set.
- The window, both baseline and after, with dates.
- The change, dated, and whether it shipped alone or in a bundle.
- The control, if you had one, with what it did over the same window.
- The alternatives you checked, named, with why each is unlikely.
- Your confidence, in plain words, and what would have made it higher.
Confidence language worth using: "the treated set moved and the control did not, over a period with no core update, so I attribute most of this to the change" is strong. "Clicks rose 40% and I believe the redirect fix caused it, though a competitor also dropped out of the top five for two of our head terms in the same fortnight" is honest and still valuable. "Traffic up 300%" with no window is not a result at all.
A minimal worked example shows the mechanics behind the limits, using round illustrative figures. Say the baseline mean for the treated pages is 900 clicks/week, with ordinary variation, the range you would expect from noise alone, of roughly plus or minus 150. After the change, the treated set averages 1,200 clicks/week, a rise of 300. Over the same window, the control set moves from a baseline mean of 850 to 890, a rise of 40. The difference-in-differences result, the change attributable to your work rather than to whatever moved both sets, is 300 minus 40, so 260 clicks/week. That figure, not the raw 300, is what you report as the effect.
SEO 24x7 result-proof worksheet
Use this worksheet before reviewing the outcome. Lock the treated and control URL lists, record the date windows and save the source export alongside the completed sheet so another analyst can reproduce the calculation.
A copyable reporting template:
- Sample size (pages or queries in treated and control sets):
- Baseline mean and ordinary variation (range or standard deviation):
- Treated-set change (after mean minus baseline mean):
- Control-set change (after mean minus baseline mean):
- Difference-in-differences (treated change minus control change):
- Observation window (baseline and after dates):
- Conclusion type: descriptive (directional, no significance test) or statistically tested (state the test and the p-value or confidence interval)
State explicitly when the sample is small or the effect has not persisted long enough to be considered durable. A two-week lift is a signal, not an outcome. If the post-change window is still short relative to the site's normal variation and expected crawl lag, label the result as preliminary.
What does this look like on a real write-up?
The shape of a defensible result, illustrative rather than a real case: a 40-page guide section gets a structured internal linking pass. Baseline is 10 weeks of GSC clicks filtered to /guides/, ranging 800 to 1,050 a week. Twenty pages are treated, twenty comparable pages are left alone as a control. The change ships on one date, logged, with nothing else touching those templates. Eight weeks later the treated set is averaging 1,400 a week and the control set is flat within its baseline range. No core update landed in the window. The write-up states the ranges, both sets, the dates, and adds that two treated pages account for a large share of the gain, so the per-page effect is uneven.
Reporting that concentration matters because an aggregate lift driven by two pages is different from a consistent section-wide effect.
The same discipline applies to GEO work, with one adjustment: citation in AI answers is not reliably reportable in the way clicks are, so lean on what you can evidence directly, such as crawler access logs, whether the passages you wrote are being served, and repeated prompt checks recorded with dates and the exact prompt used. The measurement standard does not drop just because the surface is newer. If anything it rises, because fewer people can check your work. For the structural side of that, how to earn visibility in AI Overviews and answer engines covers what actually gets served, and GEO vs SEO covers where the two disciplines diverge.
What should you check before you publish a result?
Run this before you publish any result, internally or publicly:
- Baseline window named, with source, filter and date range
- After-window is comparable in length and seasonal position
- Change date is the go-live date, recorded at the time
- Only one meaningful change in the window, or the bundle is disclosed as a bundle
- A control set exists, or its absence is stated
- Core update dates checked against the window
- Metric is segment-level, not sitewide
- Keyword or query set was fixed before measurement
- At least two alternative explanations named and addressed
- Sample size and duration stated plainly
- Nothing in the write-up would change if a sceptical reader had the raw data
If you can tick all eleven, you have a result worth publishing under your own name.
Where should you publish a provable SEO win?
Publish where a reader can inspect the method, limitations and supporting evidence without relying on a private presentation. Keep a copy of the raw export and calculation sheet, and remove client identifiers unless you have written permission to disclose them.
SEO 24x7 currently provides a case-study submission form that requires sign-in and sends submissions for review. Submission is not a guarantee of publication or indexing. If you want to contribute, use the case-study submission flow and describe only results you can support with retained evidence. The free tools can help record a technical baseline, but their outputs are diagnostic signals rather than proof of causation.