Most SEO case studies get ignored because readers cannot check them. There is no baseline, timeframe, account of other changes or metric that could have shown the work had failed. A case study earns attention when it states the starting position, identifies the change being credited, gives the dates and reports a number that could have moved in either direction. Everything below explains how to close the gap between those two versions.
The short version
- The failure is usually evidentiary. Polished writing cannot compensate for a missing baseline.
- Every claimed result needs a start date, an end date and a stated comparison period.
- Define the outcome that would have counted as failure. Without one, the claim is unfalsifiable and readers will discount it.
- Name the confounders you know about. Disclosing a seasonal spike or concurrent site migration improves credibility.
- Metrics tied to a business decision, such as qualified enquiries, revenue or indexed-and-ranking pages, survive scrutiny. Impressions and "keywords improved" rarely do.
What actually makes a reader skip a case study?
Six failures do most of the damage, and they compound. A case study with three of them reads as marketing. One with none of them reads as a report.

- Vanity metric. Looks like "Impressions up 340%". The reader concludes the number moved somewhere that does not pay wages.
- No baseline. Looks like "We got them to 12,000 sessions". From what? 11,000 is a rounding error, 400 is a story.
- No timeframe. Looks like "We grew organic traffic by half". Over six weeks or three years?
- Unfalsifiable claim. Looks like "Improved topical authority". Nothing here could have come out negative.
- Missing method. Looks like "We optimised their content". I cannot repeat this, so I cannot learn from it.
- Cherry-picked window. Looks like a chart starting at the trough. The comparison period was chosen after the result was known.
These failures are serious because experienced readers want to determine whether the reasoning transfers to their situation. Remove the method and dates, and there is nothing left to transfer.
Why do vanity metrics undermine a case study you actually won?
They suggest that a more meaningful metric was unavailable. When a case study leads with impressions, readers may assume clicks did not move enough to lead with. That inference can be unfair, yet people still make it.
Impressions are the clearest example. A page that starts ranking in position 40 for a few thousand new long-tail queries can generate a large impression increase and almost no clicks. The impressions chart climbs steeply while the business gains little. The same problem applies to "keywords ranking in the top 100", average position across an undifferentiated keyword set and third-party authority scores that search engines do not use as ranking inputs.

Sequence these metrics according to their value. Lead with the measure closest to the money, then use softer metrics to explain the mechanism. For example: "Qualified enquiries from organic rose from an illustrative monthly average of 9 to 21 across the quarter after launch. The supporting mechanism was 14 previously unindexed service pages entering the index and reaching illustrative mid-page-one positions for their target terms." In this example, impressions could help explain how the result occurred; they would not prove its business value.
What does a baseline actually need to include?
A usable baseline includes a stated metric, a measurement period before the change, a stated source and a note on what else was happening at the time. Most weak case studies omit several of these elements.
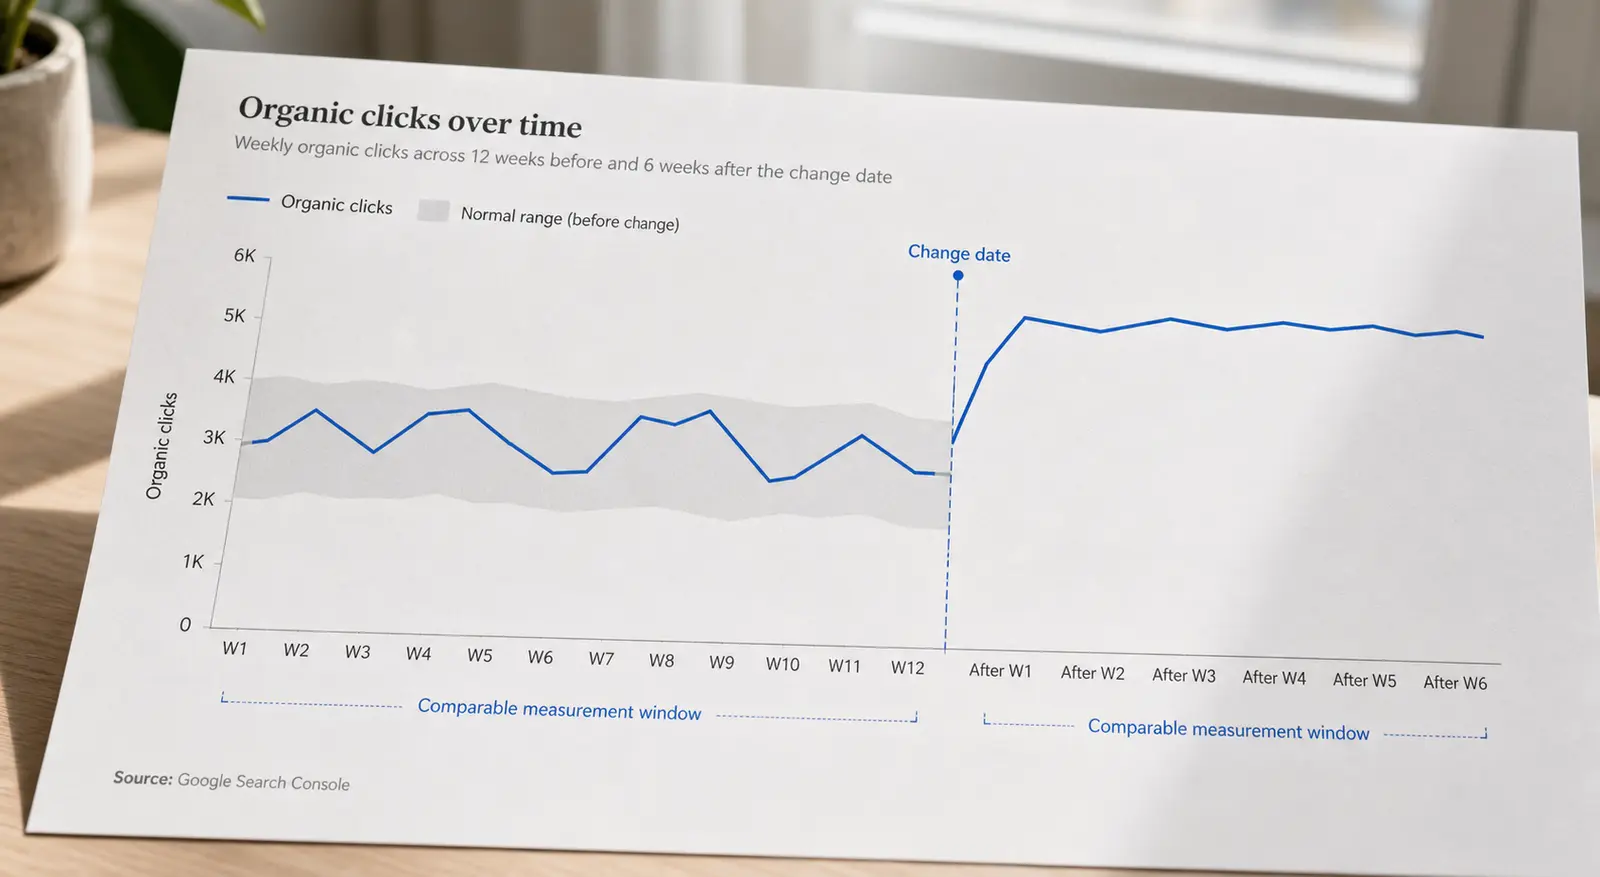
The measurement period matters more than people expect. A single month can be noisy: one unusually good week, an algorithm update or a seasonal peak can distort the comparison. Use a period long enough to contain the site's normal variation. For a seasonal business, compare the result with the same period a year earlier as well as the immediately preceding period. When both comparisons point in the same direction, report that agreement because it gives the claim more support.
Name the source explicitly. "Search Console clicks, property-level, filtered to the /services/ path" is checkable. "Our tracking" is vague. Different sources disagree for well-understood reasons. Search Console counts clicks and impressions differently from how an analytics platform counts sessions, while a rank tracker's position is a sampled snapshot rather than the average reported by a search engine. Readers familiar with those differences need to know which source you used and why.
How do you write a claim that can be proven wrong?
Write down the outcome that would make you call the work a failure before you inspect the result. Publish that condition alongside the result.
This habit resolves many credibility problems. Consider this illustrative prediction: "We expected the consolidated hub to lift clicks to the merged URL above the combined pre-merge total within 10 weeks. If it remained below that total, we would consider the merge unsuccessful." If the result clears that pre-set bar, the claim carries more weight because readers can see the threshold could have been missed.
Phrases such as "improved authority", "strengthened relevance", "better alignment with search intent" and "enhanced crawl efficiency" do not define a measurable state in which the claim would be false. They may describe a genuine intention, but readers cannot distinguish an unmeasured claim from an invented one.
A related attribution problem appears when several changes ship in the same window and the result is presented as a combined outcome. The metrics may be real, but the effect of each change cannot be tested separately. Sequence the changes with gaps between them where practical. If they shipped together, state that attribution applies to the bundle.
Which metrics survive scrutiny, and which get discounted?
The dividing line is whether a metric would change a decision. Measures a business owner would act on tend to survive scrutiny. Measures used mainly for SEO reporting tend to receive less weight.
Usually survives: revenue or qualified enquiries attributable to organic sessions; clicks to a defined page set; conversion rate on a specific template before and after a change; number of pages indexed and ranking for their intended term; time-to-index for new URLs; a Core Web Vitals field metric crossing the good/needs-improvement threshold, where the change is tied to a specific technical fix.
Usually discounted: impressions in isolation; total keyword count; average position across a mixed set; third-party authority scores; "traffic value" estimates from any tool, since these are modelled from advertising costs rather than observed; social shares.
Depends entirely on framing: sessions and rankings. Both are legitimate when scoped to a defined page or query set with a baseline. Site-wide figures without a denominator reveal little. Compare the vague claim "Organic sessions increased by 60%" with this clearly illustrative example: "Organic sessions to the 22 location pages rose from a three-month average of 340 per month to 1,100 per month over the following quarter, while the rest of the site stayed flat." The second version shows that the result was localised to the work.
That final clause is persuasive because the untouched portion of the site serves as an informal control. Include it whenever the data allows.
How do you separate what you did from what would have happened anyway?
State what else changed during the measurement window in the same paragraph as the result. There are several honest ways to approach attribution, and identifying the chosen method is more credible than implying causation the evidence cannot demonstrate.
In rough order of evidentiary strength, the practical options are: a genuine split where a comparable set of pages remains unchanged as a control; a staged rollout where the same change reaches different page groups in different months and each group moves after its own launch date; a before-and-after comparison using the rest of the site as an informal control; and a before-and-after comparison that names the confounders and limits the attribution claim.
Annotate important events. Keep a dated log of deployments, algorithm updates, site changes, campaign launches and seasonal events while the work is underway. Reconstructing that record later is difficult. A chart showing a step change three days after a documented deployment, with no nearby event in the log, supports an attribution argument. A chart reconstructed from memory six months later supports only an anecdote.
A broad core update inside the measurement window does not automatically invalidate the result, but it must be disclosed. If the site rose while the update was rolling out, state that the events coincided and explain the basis for crediting the work. Readers who identify an unmentioned update in the date range may question the rest of the evidence.
What does an honest case study look like end to end?
Structure it as situation, change, measurement, result and revision. The following is an illustrative shape rather than a real project. No numbers here describe actual work by anyone.
Situation. A site with roughly 40 service pages, all thin and templated, where the same three paragraphs appeared under different suburb names. Baseline: Search Console clicks to the /services/ directory averaged a stated figure across the preceding three months, with the corresponding period a year earlier stated for comparison.
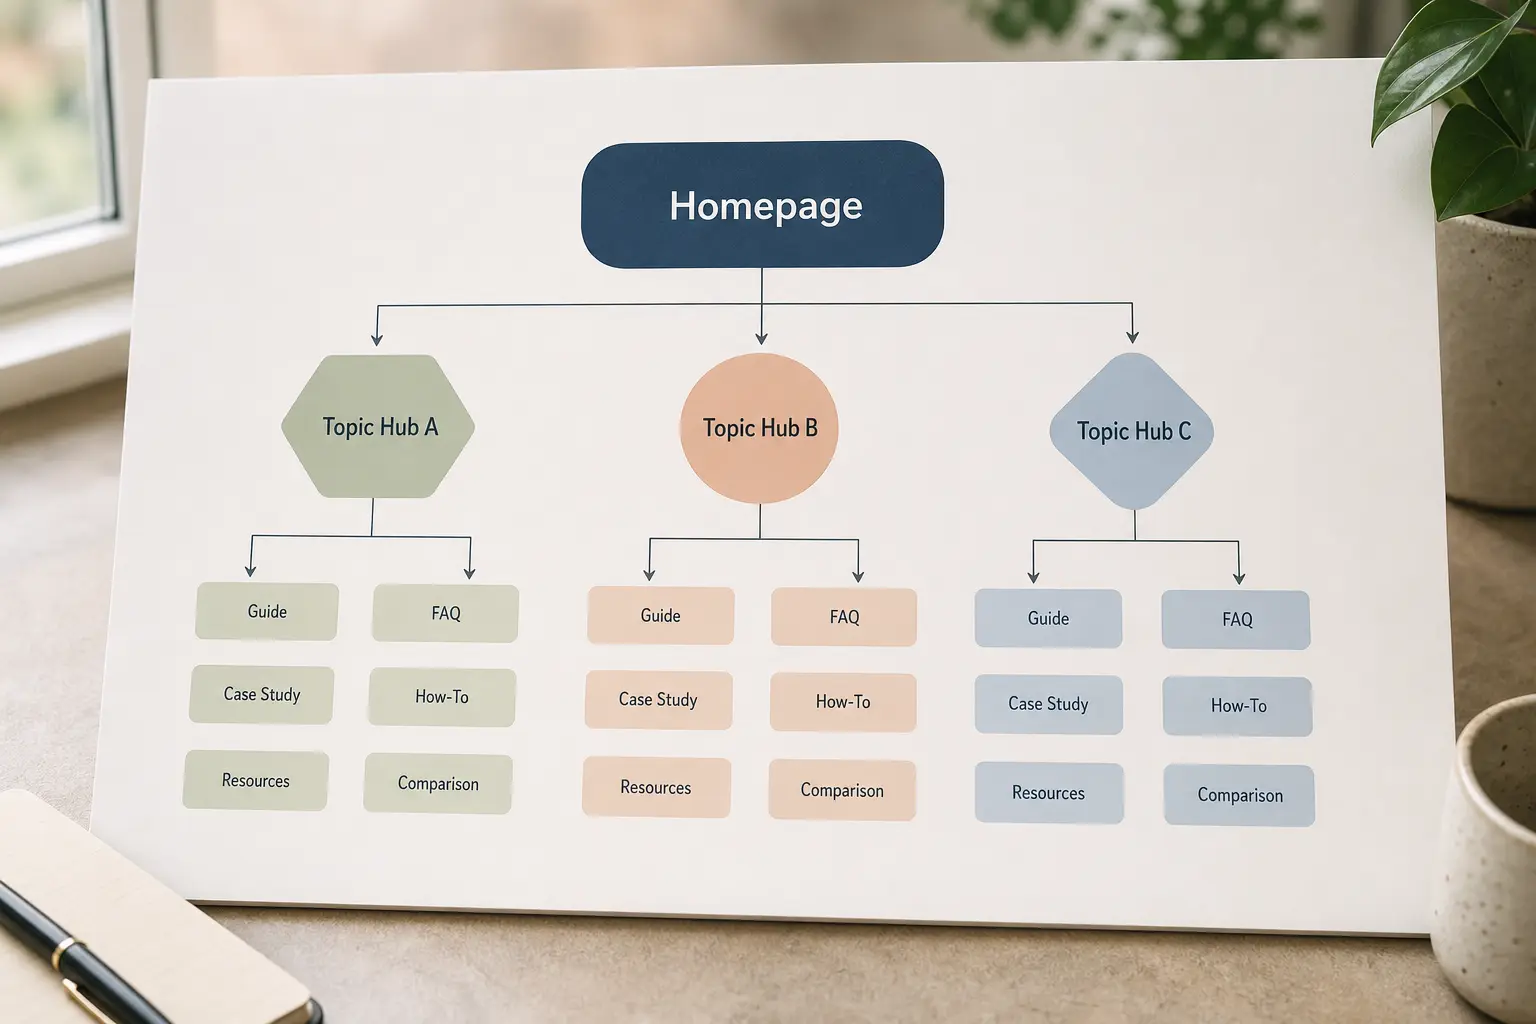
The change, and only the change. Consolidated 40 pages into 9 substantive ones, 301-redirected the rest, and left the blog and homepage untouched. No link building, technical work or new content elsewhere during the window. That final sentence defines the scope of the attribution.
How it was measured. Search Console, path-filtered, comparing the 12 weeks after the redirects resolved with the 12 weeks before the change, with the blog directory tracked as an informal control. Annotations mark the deployment date and one documented core update inside the window.
The result, with the failure condition stated. The illustrative pre-registered bar was that combined clicks to the 9 surviving URLs should exceed the combined pre-merge total for all 40 within one quarter. State whether it cleared that bar and by how much, then report what happened to the control directory over the same period.
What you would do differently. This section makes your judgement visible and is often cut for length. For example: "The redirects and content rewrite shipped on the same day, so I cannot separate the consolidation effect from the content-quality effect. Next time, I would redirect first, wait four weeks, then rewrite."
Publishing that limitation helps readers distinguish the case study from a sales document. It shows where the evidence ends.
The 60-second credibility check before you publish
Run this checklist over your draft. Every "no" identifies a missing section or qualification.
- Is there a stated baseline metric, period and source?
- Are the start and end dates of the measured window on the page?
- Would a reader know what outcome would have counted as failure?
- Is the primary number tied to a business decision rather than a dashboard?
- Have you named everything else that changed during the window, including any known algorithm update?
- Could a competent reader repeat your method from what is written?
- Is there something on the page that did not go your way?
- Were the chart's start and end points chosen for reasons you would defend openly?
Seven yeses out of eight indicate a publishable case study. Three describe a testimonial with charts.
Publish yours where it can be found
Work kept in a closed group or client deck cannot be read, checked or cited by people outside that audience. SEO 24x7 runs a public case-study platform at /community, built for evidence-led write-ups and attached to your @handle.
The platform is in beta and the leaderboard is currently empty. Claim an @handle at /welcome, then publish at /case-studies/new. Before publishing, use the free Page Checker to assess the page for traditional SEO and AI-search readability.