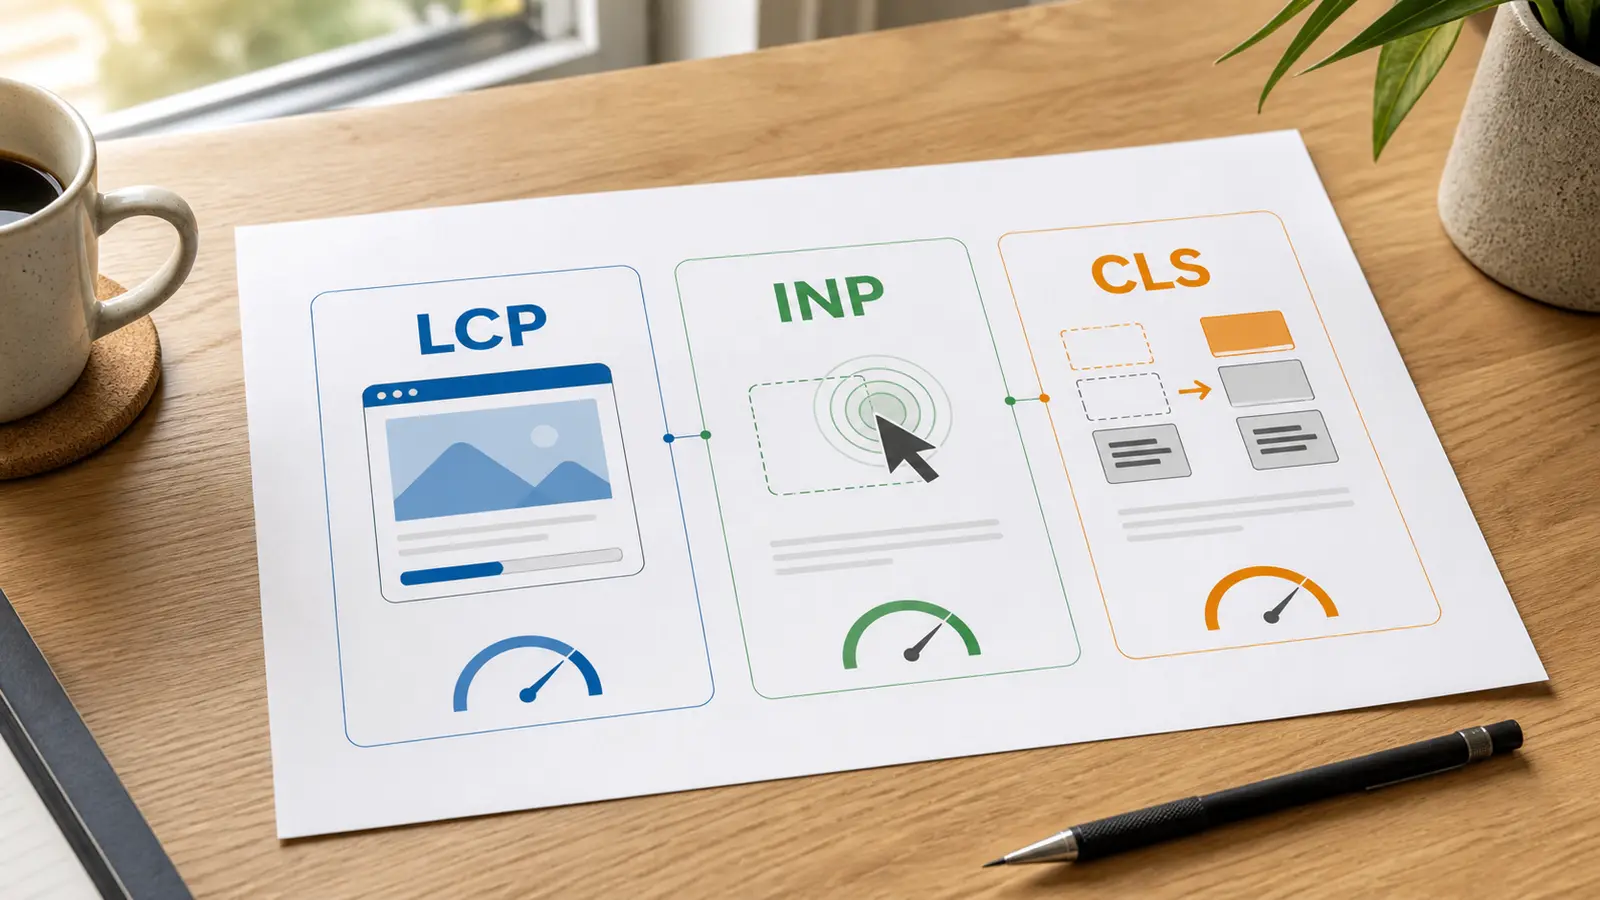
Core Web Vitals are three field metrics Google uses to score real user experience: Largest Contentful Paint (LCP) measures loading, Interaction to Next Paint (INP) measures responsiveness, and Cumulative Layout Shift (CLS) measures visual stability. The good thresholds are LCP ≤ 2.5s, INP ≤ 200ms, and CLS ≤ 0.1. A reported URL or URL group passes when all three are rated good at the 75th percentile of real visits in the relevant field dataset; check whether the report uses URL-level data, an origin fallback, or a Search Console URL group, and review mobile and desktop separately. If your speed test flagged one as failing, the fix depends on which one, because each has different causes.
Key takeaways
- LCP measures how fast the main content loads, INP how quickly the page responds to taps and clicks, and CLS how much the layout shifts.
- "Good" thresholds: LCP ≤ 2.5s, INP ≤ 200ms, CLS ≤ 0.1, all measured at the 75th percentile of real visits.
- INP replaced First Input Delay (FID) as a Core Web Vital in March 2024.
- Lab tools (Lighthouse) estimate causes; field data (CrUX, Search Console) reflects the experience Google measures for ranking. Diagnose in the lab, confirm in the field.
- Common LCP causes include late-discovered hero images, slow server responses, and render-blocking resources. Common CLS causes include missing media dimensions, unreserved ad slots, font swaps, and content inserted after the initial render.
What are Core Web Vitals and does Google actually rank on them?
Core Web Vitals are a subset of Google's page experience signals, and yes, they are a live ranking factor, though a modest one. Google includes Core Web Vitals in its page-experience systems, but relevance and content quality remain more important. Passing the thresholds does not guarantee higher rankings, and failing them does not automatically prevent a relevant page from ranking. The bigger reason to fix them is behavioural. A page that loads slowly or shifts under a reader's thumb loses conversions and revisits regardless of ranking.
Google scores the three metrics at the 75th percentile of real-world visits over a rolling 28-day window, drawn from the Chrome User Experience Report (CrUX). That detail matters: your own fast laptop on office fibre is not the visit being measured. A quarter of your slowest real visits can drag a URL into "needs improvement" even when the page feels fine to you.
Lab data vs field data: why your Lighthouse score disagrees with Search Console
Lab tools run one simulated load on a fixed device and connection. Field data records thousands of real loads across every device, network, and interaction pattern your actual audience brings. They routinely disagree, and when they do, field data reflects the experience Google measures for ranking.
INP commonly exposes this difference because a Lighthouse load test does not reproduce a visitor's full sequence of interactions. Lighthouse cannot fully measure INP, because INP depends on a user actually interacting with the page: tapping a menu, opening an accordion, submitting a form. A lab run with no interaction reports a Total Blocking Time estimate instead, which is a proxy, not the metric. So a page can score 99 in Lighthouse and still fail INP in the field.
Use both, but for different jobs. Field data shows whether eligible Chrome users are experiencing a problem and can reveal patterns by URL group, device type, or origin. Lab tools such as Lighthouse or the SEO 24x7 speed test help reproduce likely causes under controlled conditions, but one run may miss interaction problems or conditions that occur only for some users. Use field data to set the priority, then reproduce and test the suspected bottleneck in the lab.
To work through a disagreement, consider a hypothetical product page with a strong Lighthouse load score but poor field INP. First segment CrUX data by device, then reproduce the page's menu, filter, and add-to-cart interactions in DevTools and inspect the longest interaction's input delay, processing time, and presentation delay separately. For example, consider a hypothetical filter click with 420 ms interaction latency: 40 ms of input delay, 310 ms of event-handler work, and 70 ms of presentation delay. The largest component is processing time, so begin in the JavaScript profile rather than resizing images or changing the server. The same reasoning generalises. If input delay dominates, look for long tasks already occupying the main thread. If processing time dominates, profile the event handler and the work it triggers. If presentation delay dominates, inspect style recalculation, layout, rendering, and DOM size. If the problem appears only in field data, instrument real interactions by interaction type before changing code.
What is LCP and how do you fix a slow one?
LCP is the time from navigation start until the largest content element in the viewport finishes rendering, usually a hero image, a video poster, or a large block of heading text. At the 75th percentile, LCP is rated good at 2.5 seconds or less, needs improvement above 2.5 seconds and up to 4 seconds, and poor above 4 seconds.
Before you fix anything, identify which element *is* the LCP element on the page, because optimising the wrong asset wastes time. Chrome DevTools' Performance panel labels it directly, and PageSpeed Insights names it under the LCP diagnostic. Once you know the element, work through the four phases LCP breaks into.
Time to first byte. Slow server response delays everything downstream. Cache HTML where you can, put the site behind a CDN so bytes travel a shorter distance, and cut slow database queries or heavy server-side rendering on the critical page.
Resource load delay. This is the gap between the page starting and the browser even *discovering* the LCP image. It is the most common hidden cause. If your hero image is set as a CSS background, lazy-loaded, or injected by JavaScript, the browser finds it late. Expose the image in the initial HTML as a plain <img> tag and avoid lazy-loading it. Use fetchpriority="high" when the browser needs a priority hint. Consider a preload when the resource cannot otherwise be discovered early, such as a CSS background image, and verify in the network waterfall that it improves discovery without competing with critical resources.
Resource load time. An oversized hero image can make resource load time the dominant part of LCP, especially on slower mobile connections. Compress it, serve an appropriate format (WebP or AVIF), and use responsive image candidates through srcset so the browser does not fetch more pixels than it needs.
Render delay. Render-blocking CSS and synchronous JavaScript in the <head> hold up painting. Inline the small amount of CSS needed for above-the-fold content, defer the rest, and defer non-critical scripts.
A worked sequence for a failing page: move the hero image into HTML as a real <img>, give it a high priority hint, convert it to WebP at the right dimensions, and defer the third-party scripts loading in the head. These changes address several common sources of LCP delay, but the improvement will depend on which phase dominates your page's LCP. Measure each phase before deployment, then compare the same page and test conditions afterwards.
What is INP and how is it different from the old FID metric?
INP measures responsiveness across the whole visit, not just the first interaction. It records the latency of nearly every tap, click, and key press on the page, then reports close to the worst one. Good is 200ms or less; anything over 500ms is poor. INP became a Core Web Vital in March 2024, replacing First Input Delay.
The difference from FID is why so many sites that "passed" suddenly failed. FID measured only the *delay before* the browser started processing the first interaction, a low bar most pages cleared. INP measures the *full* time from interaction to the next frame painted, for *every* interaction, including the processing work and the rendering. INP therefore captures responsiveness across more of the visit and includes processing and presentation delay, making it more representative than FID of the experience after an interaction.
Poor INP often involves excessive main-thread work. JavaScript is a frequent cause, but style calculation, layout, rendering, and an oversized DOM can also delay the next frame. The main thread is the single lane where the browser both runs your scripts and responds to user input. When a long task hogs that lane, taps queue behind it. Fixes, in rough order of impact:
- Break up long tasks. Split heavy JavaScript work into smaller chunks and yield to the main thread between them so input can be handled in the gaps.
- Cut third-party script weight. Analytics, chat widgets, A/B testing tools, and tag managers are frequent INP offenders. Audit what is loading and remove what you cannot justify.
- Defer work that does not need to happen on interaction. Do the visible update first (open the menu, show the checkmark), then run the heavier logic afterwards rather than blocking the response.
- Reduce DOM size. Very large pages make every render step slower, which inflates the rendering portion of INP.
What is CLS and what causes elements to jump around?
CLS measures how much visible content shifts position unexpectedly during a visit. Every reader has tapped a button that moved at the last second because an ad loaded above it; CLS quantifies exactly that. Good is 0.1 or below; above 0.25 is poor. It is a unitless score based on how much of the viewport moved and how far.
Most CLS problems come from four sources:
- Images and video without dimensions. When the browser does not know an asset's size, it reserves no space, then reflows everything when the asset arrives. Set explicit
widthandheightattributes (or a CSSaspect-ratio) on every image and embed so the space is held from the start. - Ads, embeds, and iframes. Reserve a fixed slot of the right size for each ad unit before it loads, so late-arriving content fills a hole rather than pushing content down.
- Web fonts. A custom font swapping in can reflow text and shift layout. Use
font-display: optionalorswapwith a well-matched fallback so the shift is minimal. - Content injected above existing content. Cookie banners, notification bars, and "you might also like" blocks that insert at the top push everything down. Reserve their space, or inject them in a way that overlays rather than displaces.
CLS is often among the lower-effort Core Web Vitals to address, because the changes are usually small and low-risk: adding dimensions and reserving space rarely breaks anything.
Core Web Vitals thresholds at a glance
LCP
- Measures: Loading of largest element
- Good: ≤ 2.5s
- Needs improvement: > 2.5s and ≤ 4.0s
- Poor: > 4.0s
INP
- Measures: Responsiveness to all interactions
- Good: ≤ 200ms
- Needs improvement: > 200ms and ≤ 500ms
- Poor: > 500ms
CLS
- Measures: Visual stability
- Good: ≤ 0.1
- Needs improvement: > 0.1 and ≤ 0.25
- Poor: > 0.25
All three are judged at the 75th percentile of real visits, and a URL must clear "good" on all three to pass.
A practical order to fix Core Web Vitals
Prioritise the metric and template affecting the most users, then compare expected impact, implementation effort, and regression risk. The following sequence is a starting point, not a rule:
- Pull field data first. Open Search Console's Core Web Vitals report to see which metric fails and how many URLs share the same failing template. Fixing one template often fixes hundreds of URLs.
- Rank affected groups by traffic, severity, and business importance.
- For each group, identify the dominant metric and its largest contributing phase or interaction.
- Choose the lowest-risk change that addresses that measured cause; do not assume CLS, LCP, or INP must always be handled first.
- Wait for the field to update. CrUX runs on a 28-day window, so a deployed fix takes weeks to show as "passing" in Search Console even when the lab confirms it immediately.
Use this guide to decide which metric and delay phase to investigate. Use the SEO 24x7 speed test to reproduce loading issues on a single page, or run the page check when you need a broader technical review. If Core Web Vitals is your entry point into technical SEO, the structured Learn SEO path puts performance in context alongside the rest of the fundamentals. Use the SEO 24x7 community to discuss your trace and compare diagnostic approaches with other practitioners.
Frequently asked questions
Do Core Web Vitals affect rankings directly?
Core Web Vitals contribute to Google's page-experience signals, but Google says strong page experience does not override relevance. Treat them as one part of search performance and user experience, not as a guaranteed ranking lever.
Why does my page pass in Lighthouse but fail in Search Console?
Lighthouse runs one simulated load and cannot fully measure INP, which needs real interaction. Search Console uses field data from real visits at the 75th percentile. Use field data to judge the experience real Chrome users receive and lab data to reproduce and diagnose individual problems. Search Console may group similar URLs, so confirm whether the result represents the exact URL, an origin-level fallback, or a URL group before drawing conclusions.
How long after a fix will Core Web Vitals update?
Field data uses a rolling 28-day window, so expect roughly four weeks before a deployed fix shows as improved in Search Console, even though lab tools confirm the change instantly.
Is INP the same as page speed?
No. Page speed usually means load time, which INP does not measure. INP measures responsiveness: how quickly the page reacts when a visitor interacts with it after it has loaded.
Which Core Web Vital should I fix first?
Whichever your field data shows failing. When more than one fails, CLS is usually the fastest and lowest-risk to fix, followed by LCP, with INP last because it is the most involved.